Analyze Stock Price Movements
Provide date range for events and see which stocks were most impacted
How It Works
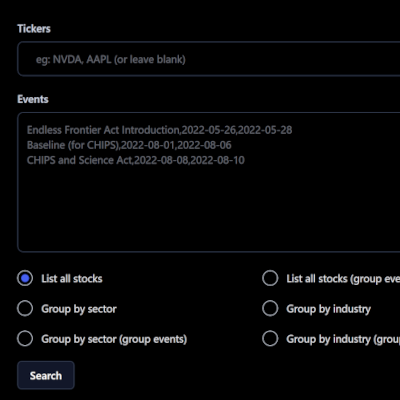
1) Input Dates of Interest
Specify stocks of interest (or search all), group results by industry or sector
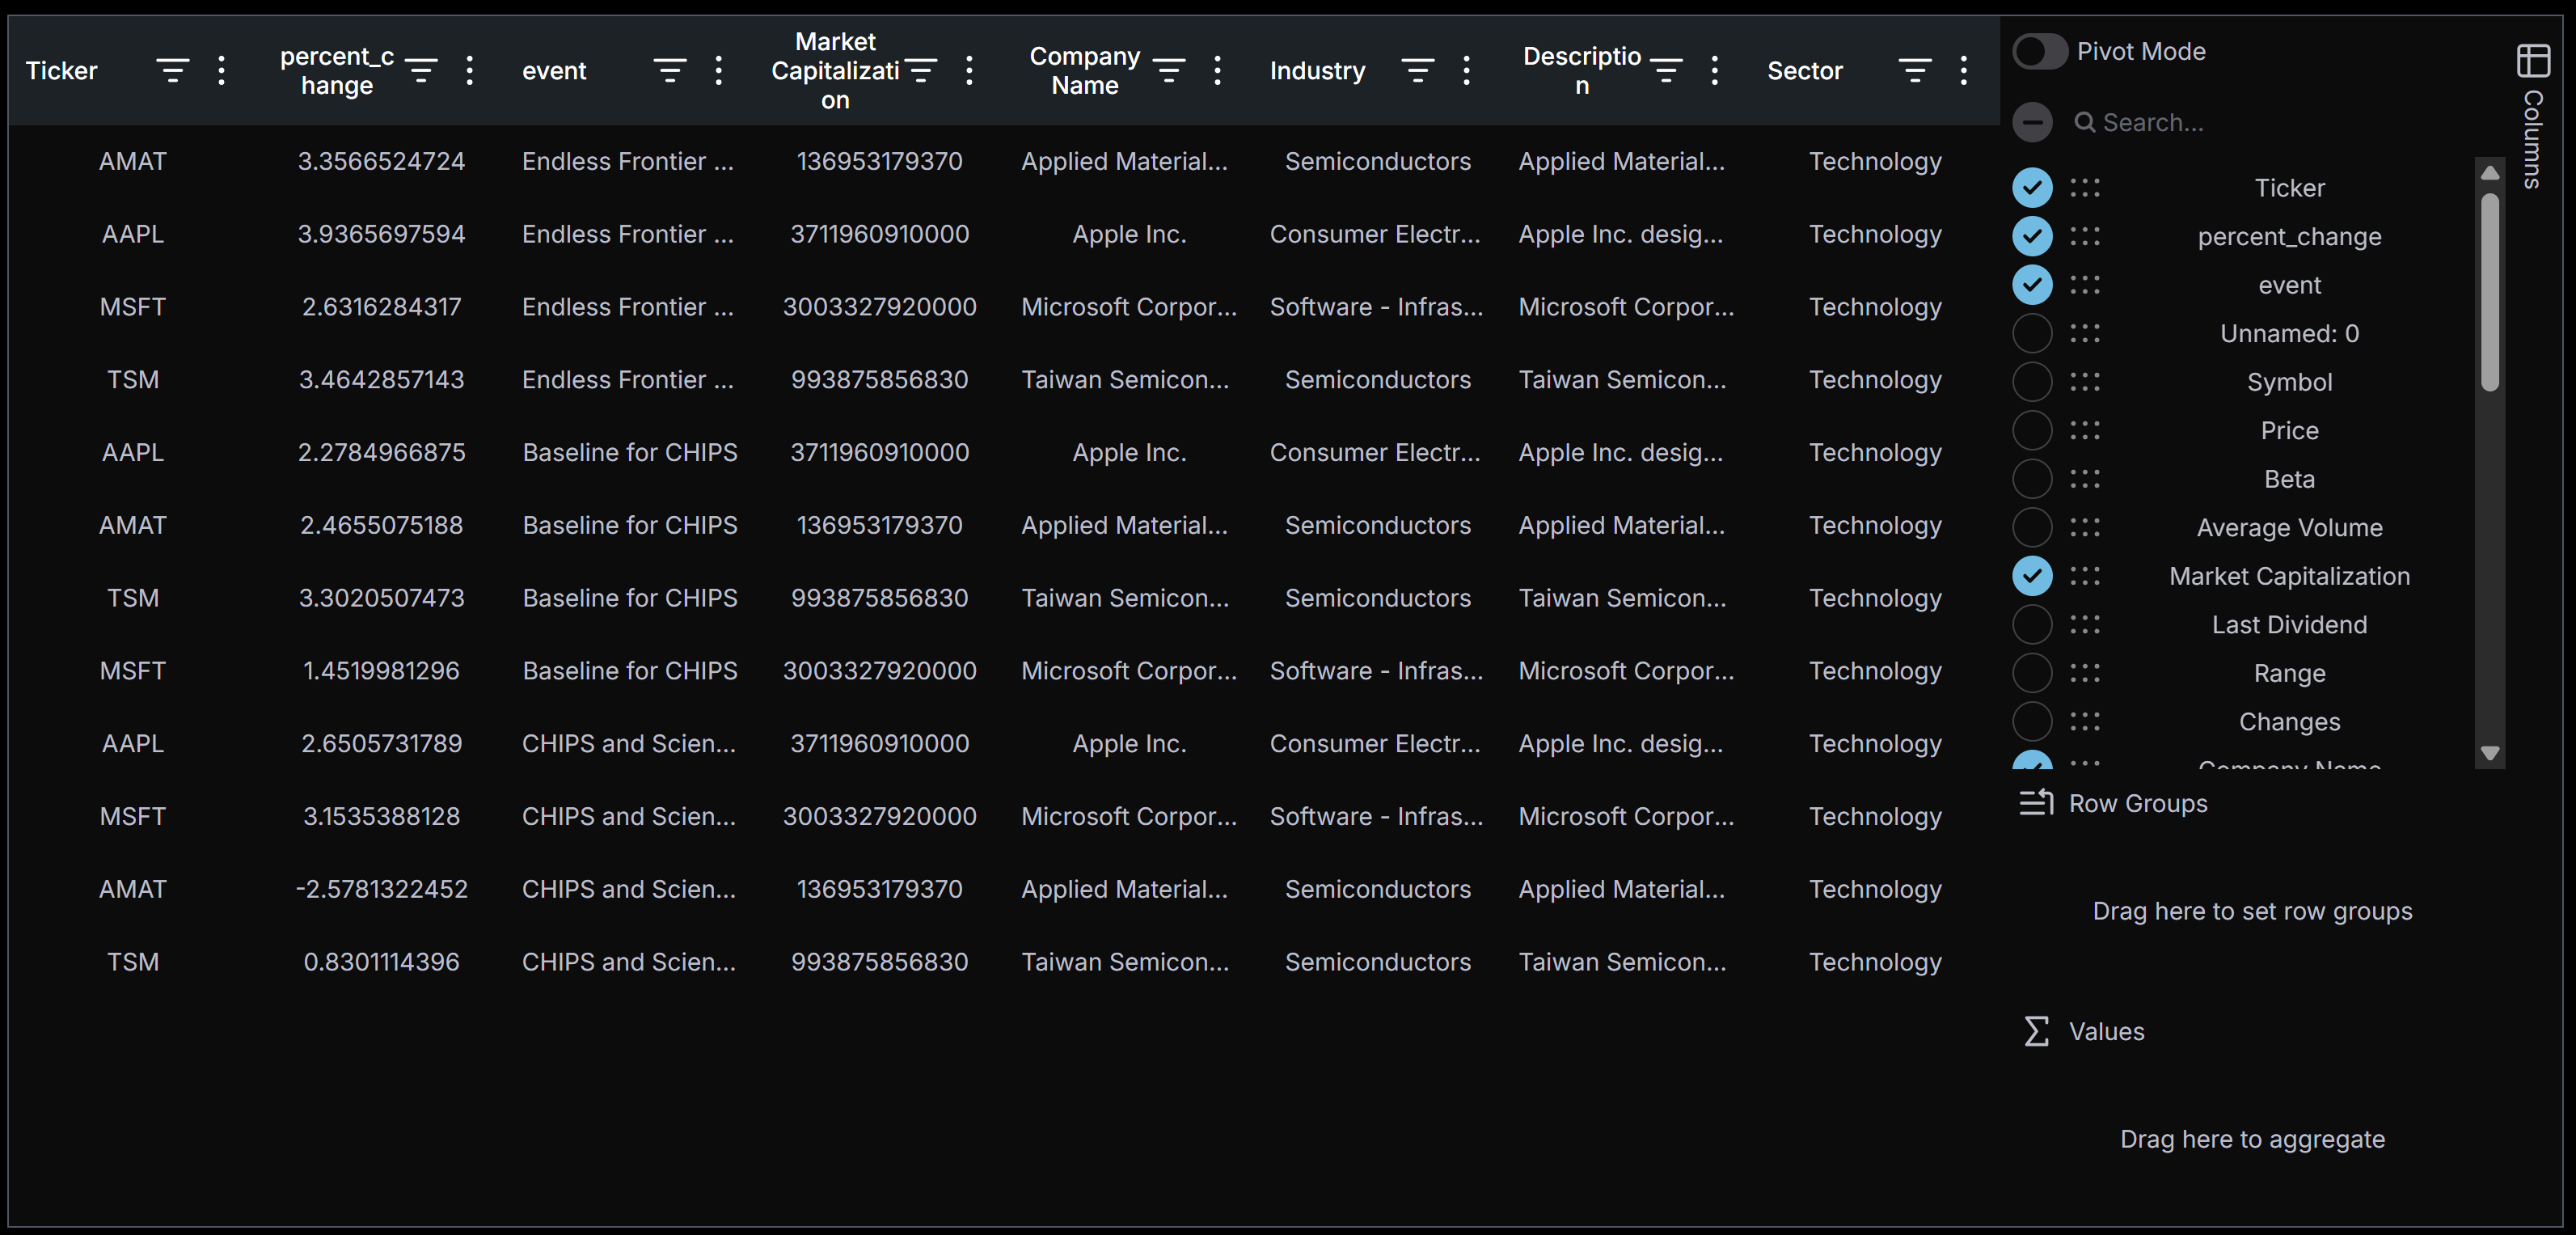
2) Grid Views
Results displayed in grid with filtering and sorting functionality
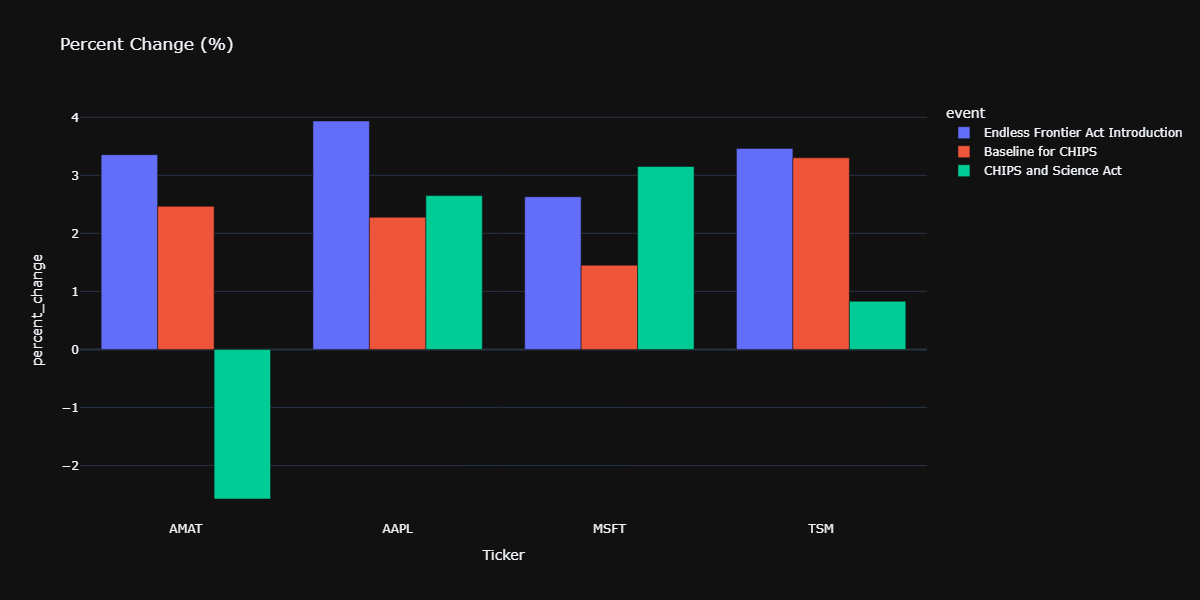
3) Charts
View results as bar charts & box charts